
22nd Mar 2018
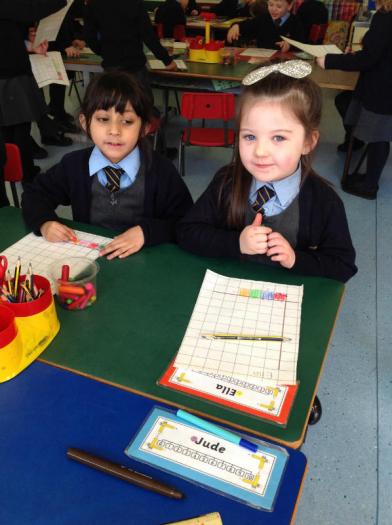
We have been talking about data handling this week. It is collecting information and displaying it on a table and graph. We had work to do in our Heinemann books, once we had completed that we got to make our own graphs. We got to ask our friends which colour was their favourite. Once they had told us we then drew a smiley face. Once all the data was collected on the graph, we had to answer questions about what was the most popular and least popular colour.
You could try make a graph or table in your house.


Archive
&nsbp;